Figure 1.

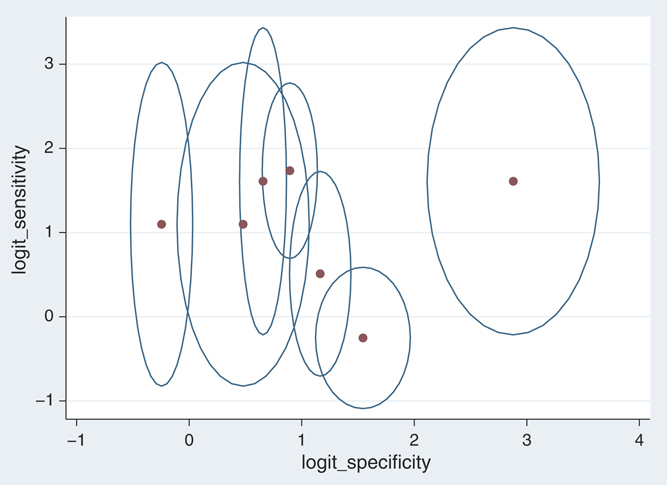
Bubbleplot of the 7 studies that comprise example 1. The bubbles show 50 per cent study-specific confidence regions based on normal within-study approximations.

Bubbleplot of the 7 studies that comprise example 1. The bubbles show 50 per cent study-specific confidence regions based on normal within-study approximations.