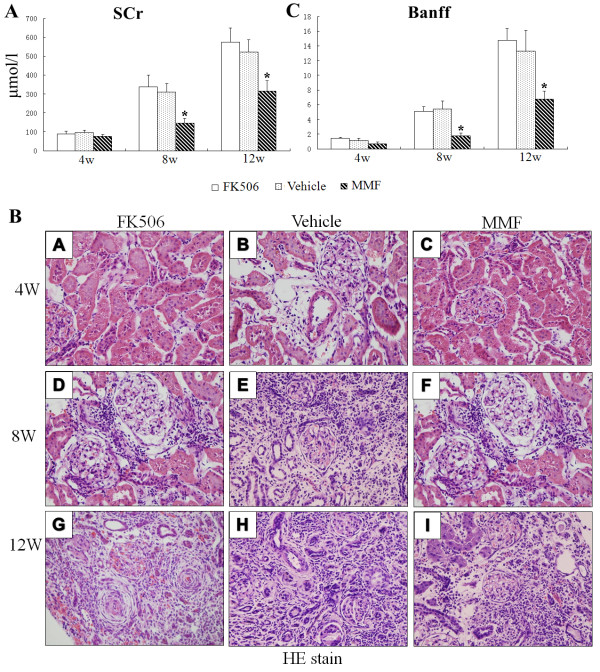
Figure 1.
Renal function and histopathological changes after transplantation.(A) Serum creatinine levels were determined by automatic biochemistry analyzer 4, 8, and 12 weeks after transplantation. Values are shown as mean ± SD from three independent experiments. (B) HE staining was performed to determine histopathological changes. Original magnification: ×400. (C) The Banff score was scored by the quantitative criteria of Banff 97 using HE results. Values are shown as mean ± SD from three independent experiments. *Significant difference compared with the control group (p < 0.05).

