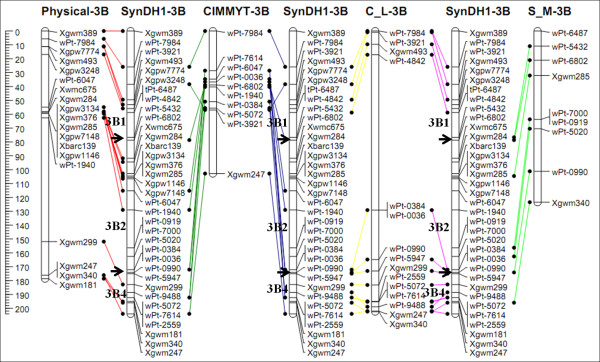
Figure 3 .

Comparison of chromosome 3B maps. The SynDH1 map (SynDH1-3B) obtained in this study was compared with the physical map (physical-3B) [7], the CIMMYT-integrated map (CIMMYT-3B) [4], the durum wheat integrated map (C-L-3B) [5], and triticale genetic map (S-M-3B) [6]. The scales on the left side indicate distances in cM (Kosambi). The black arrow indicates the point of separation between two different linkages. To reduce complexity, only markers shared between these maps are shown. Map comparison was performed using the JoinMap 4.0 program [44]].
