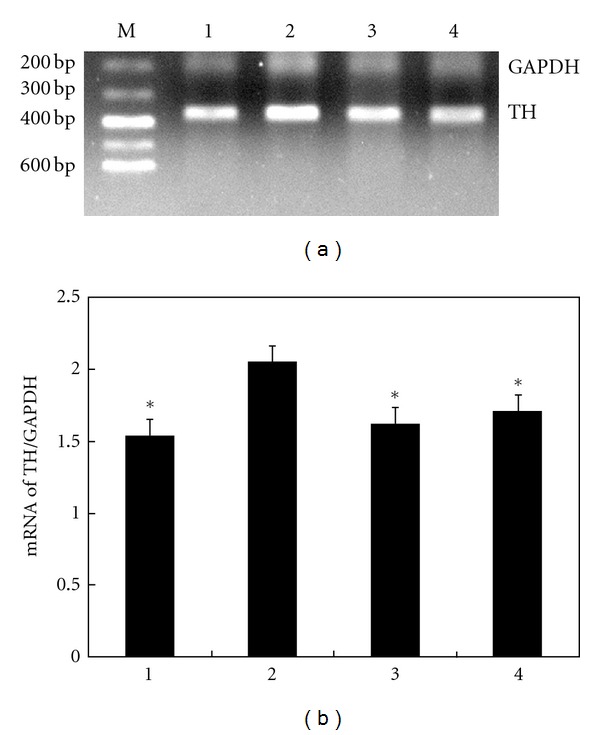
Figure 6.

(a) RT-PCR products by electrophoresis of TH and GAPDH in the infarct border zone. (b) Ratio of TH band area × A to GAPDH in the infarct border zone. M: marker; 1: sham-operated group; 2: control ischemic group; 3: preischemic treatment group; 4: delayed application group.
