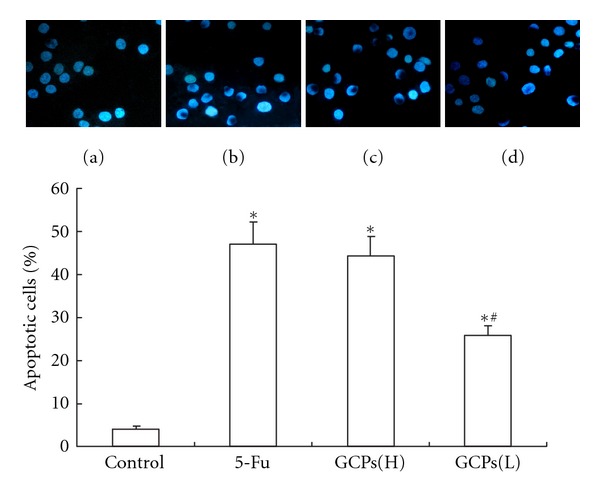
Figure 1.

Hoechst-stained nuclei of apoptotic myocytes were analyzed morphologically and were expressed as the percentage of total nuclei (magnification ×400). (a) NS control group; (b) 1.3 mg/mL 5-Fu; (c) GCPs (H): 1.6 mg/mL GCPs; (d) GCPs(L): 0.8 mg/mL GCPs. The percentage rate of apoptotic cells was presented in bar graph. The data were expressed as the mean ± SEM. *P < 0.05 versus control. #P < 0.05 versus 5-FU.
