
Figure 4.
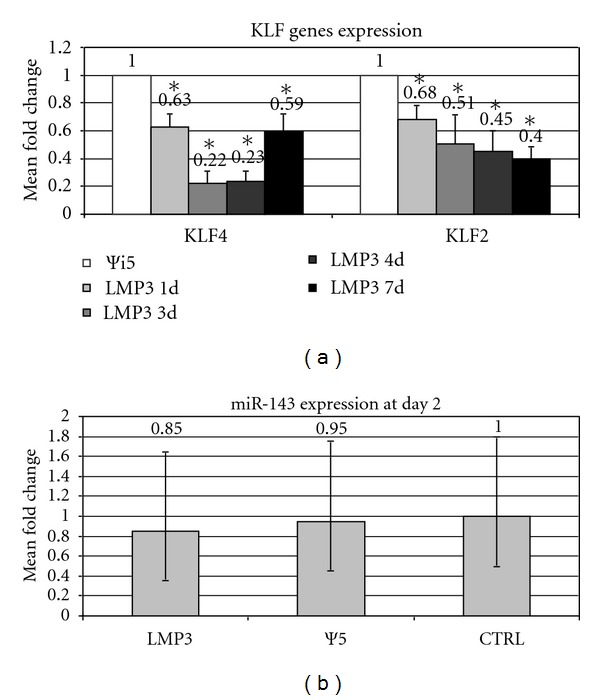
KLF genes expression analysis. Values represent the mean of triplicate experiments for each time point tested, namely, 2, 4, and 7 days after AdLMP3-mediated cell transduction; Ψ5: control sample represented by mock-transduced cells. Fold change was calculated according to the 2‒ΔΔCt method. *: statistical significance (P < 0.05).