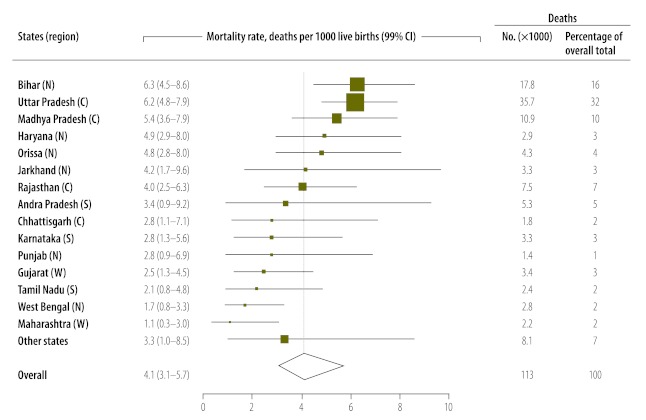
Fig. 3.
Estimated mortality rates and diarrhoeal deaths due to rotavirus infection among Indian children younger than 5 years, by state, during 2005
CI, confidence interval; C, central region; N, north region; NE, north-east region; E, east region, S, south region; W, west region.
Note: Data for the 15 states with the greatest number of estimated rotavirus deaths is shown and are arranged by estimated rotavirus mortality rates, with data for the remaining states grouped together under “Other states”. The size of the boxes denoting mortality rates is proportionate to the state’s total estimated rotavirus deaths.
Values were calculated using data from the Million Death Study (collected during 2001–2003) and the Indian Rotavirus Strain Surveillance Network (collected during 2005–2007) that were corrected on the basis of United Nations estimates of live births (14 180 792 boys and 13 130 363 girls) and deaths in India during 2005.

