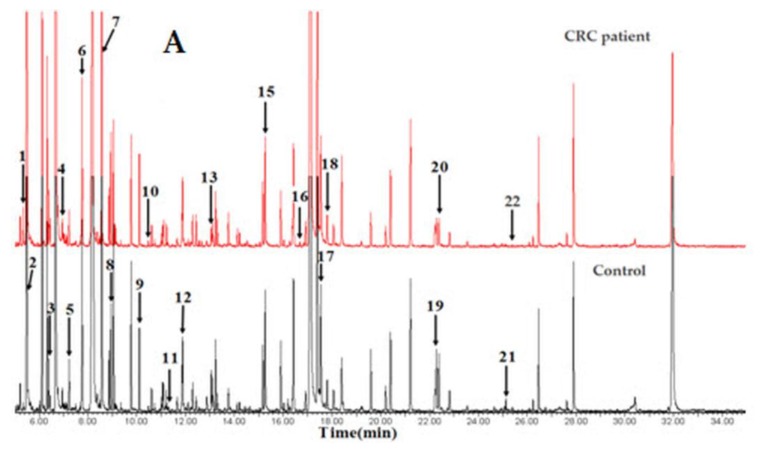
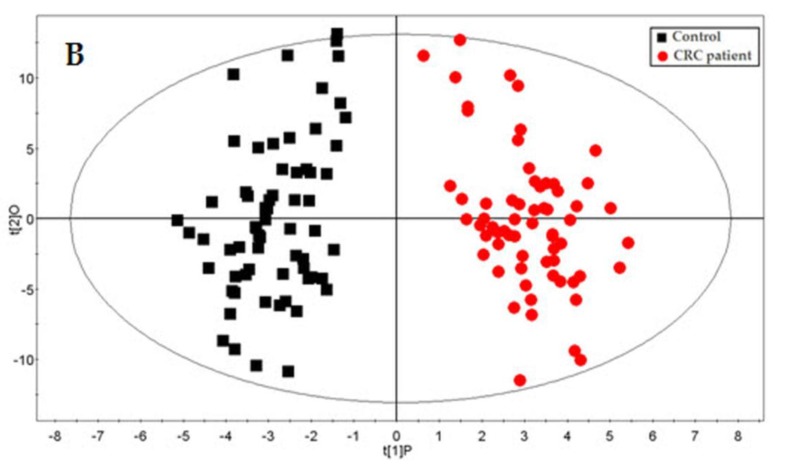
Figure 3.
GC-ToFMS analysis of colorectal cancer (CRC) patient and healthy control: (A) TIC of CRC patient (top) and healthy control (bottom) and (B) OPLS-DA scores plot differentiating CRC patients and healthy controls (reproduced with permission from 80)


