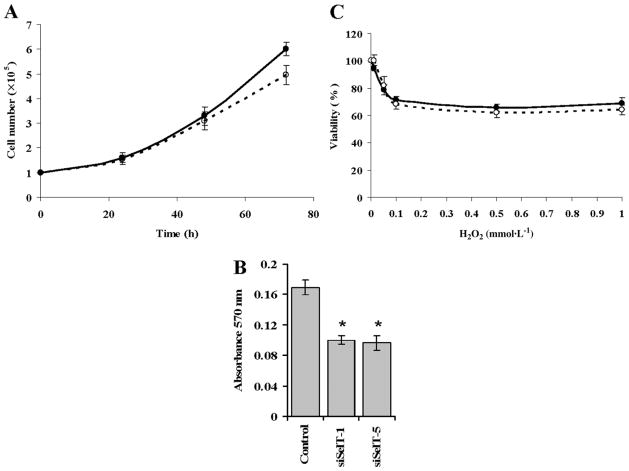
Fig. 2.
Adhesion, growth rate, and sensitivity to oxidative stress of NIH 3T3 cells deficient in SelT. (A) Control and the 2 SelT knockdown cells were seeded at a density of 1 × 10⁵ cells per well in a 6-well culture dish and cell numbers counted at 24, 48, and 72 h intervals to assess growth rates. (B) The adherence of control and SelT knockdown cells plated in a 96-well tissue culture plate was measured by optical density reading (570 nm) as described in Materials and methods. (* p ≤ 0.05). (C) Sensitivity of cells to oxidative stress following treatment with hydrogen peroxide was examined as described in Materials and methods. The growth rates and oxidative stress sensitivity of control cells are shown by filled circles and solid lines (—●—), whereas those of SelT knockdown cells are shown by open circles with dashed lines (–○–). The data plotted for the knockdown cells are the average of siSelT-1 and siSelT-5 cells.

