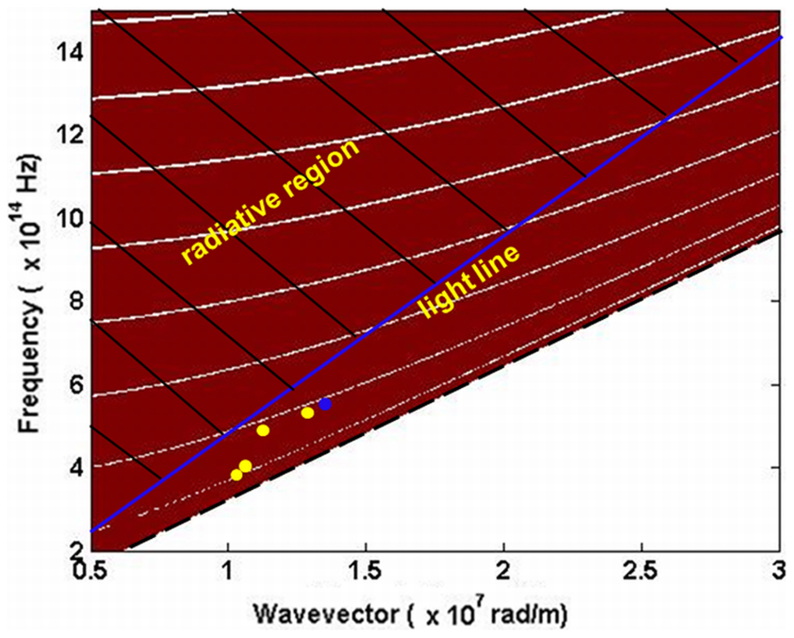
Figure 4. Surface dispersion diagram (band structure) of graphene-based Bragg grating for TM polarization.
Radiative and non-radiative regions (photonic bands) are represented by red dark region and narrow white regions, respectively. Light line for air is indicated by solid (blue) line. The hatched region represents the surface wave vector values that are radiative on the air side of the interface. Yellow dots represent the numerically estimated wave vector values for wavelengths 800 nm, 750 nm, 700 nm and 650 nm, and blue dot represents the experimentally obtained wave vector value for the wavelength 633 nm.

