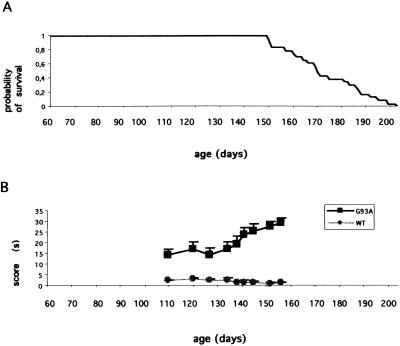
Figure 1.
Cumulative probability of survival for G93A mice (A) and motor performance through time (B) in G93A (solid squares) and wt (shaded circles) mice in a behavioral test assessing muscle strength. Each mouse was suspended by its front legs on a tight rope, and the time used to put one hind leg onto the rope was measured (this time was arbitrarily limited to 30 sec). Data are means ± SEM of the scores for 12 G93A and 12 wt mice. Score means of the two groups were compared by using Student's t test.

