
Figure 2.
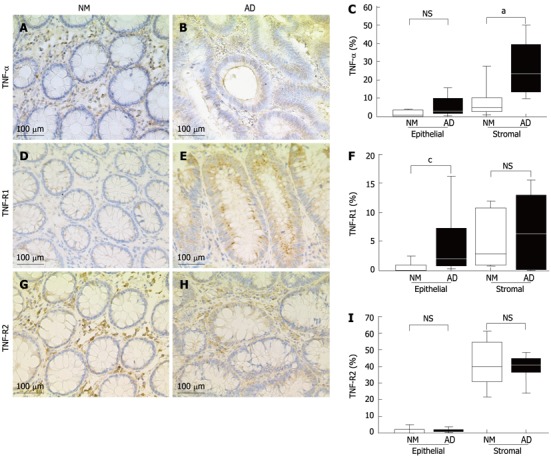
Immunohistochemical analyses in the normal colorectal mucosa and adenoma tissues. A: Tumor necrosis factor (TNF)-α expression in the normal colorectal mucosa; B: TNF-α expression in the adenoma tissues; C: The percentage of TNF-α-positive cells; D: Tumor necrosis factor-receptor 1 (TNF-R1) expression in the normal colorectal mucosa; E: TNF-R1 expression in the adenoma tissues; F: The percentage of TNF-R1-positive cells; G: TNF-R2 expression in the normal colorectal mucosa; H: TNF-R2 expression in the adenoma tissues; I: The percentage of TNF-R2-positive cells. Box plots display median values and interquartile ranges (C, F, I). The non-outlier range is also shown. aP < 0.05 between NM and AD in stromal of TNF-α; cP < 0.05 between NM and AD in epithelial of TNF-R1. NS: Non-significant; NM: Normal mucosa; AD: Adenoma.