
Figure 3.
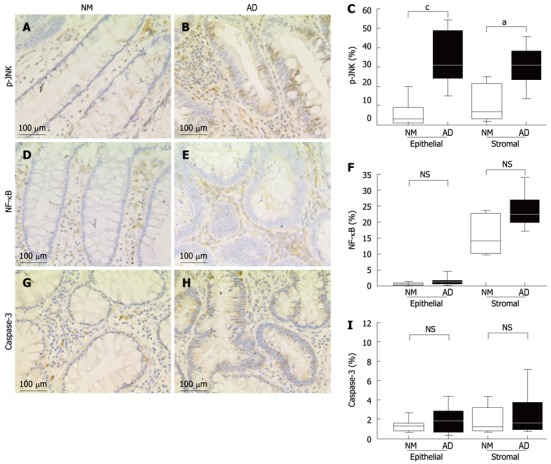
Immunohistochemical analyses in the normal colorectal mucosa and adenoma tissues. A: Phospho-c-Jun N-terminal kinase (p-JNK) expression in the normal colorectal mucosa; B: p-JNK expression in the adenoma tissues; C: The percentage of p-JNK positive cells; D: Nuclear factor-κ B (NF-κB) expression in the normal colorectal mucosa; E: NF-κB expression in the adenoma tissues; F: The percentage of NF-κB-positive cells; G: Caspase-3 expression in the normal colorectal mucosa; H: Caspase-3 expression in the adenoma tissues; I: The percentage of caspase-3-positive cells. Box plots display median values and interquartile ranges (C, F, I). The non-outlier range is also shown. aP < 0.05 between NM and AD in stromal of p-JNK; cP < 0.05 between NM and AD in epithelial of p-JNK. NS: Non-significant; NM: Normal mucosa; AD: Adenoma.