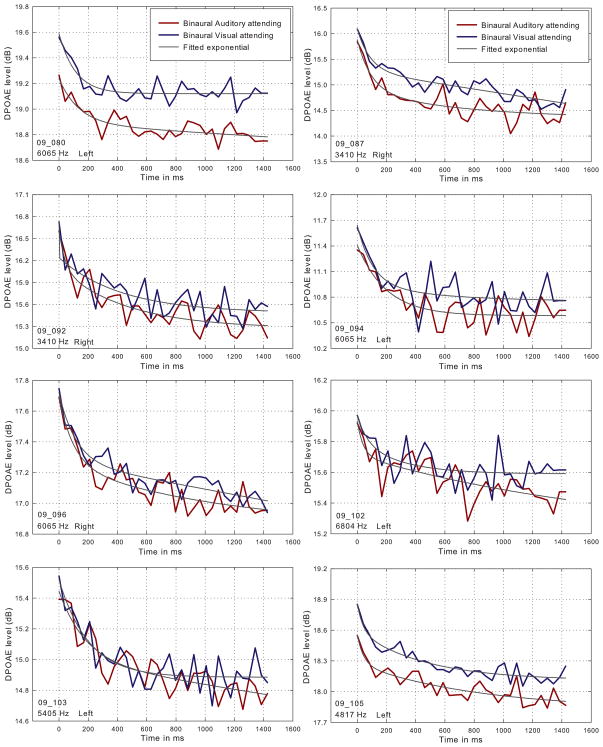
Figure 1.
Individual DPOAE adaptation contours measured for eight listeners under conditions of attending to the DPOAE-eliciting tones, while ignoring the Gabor patches (red line), and while attending to the Gabor patches and ignoring the eliciting tones (blue line). The f2 frequency and chosen ear are displayed on the bottom left of each graph.

