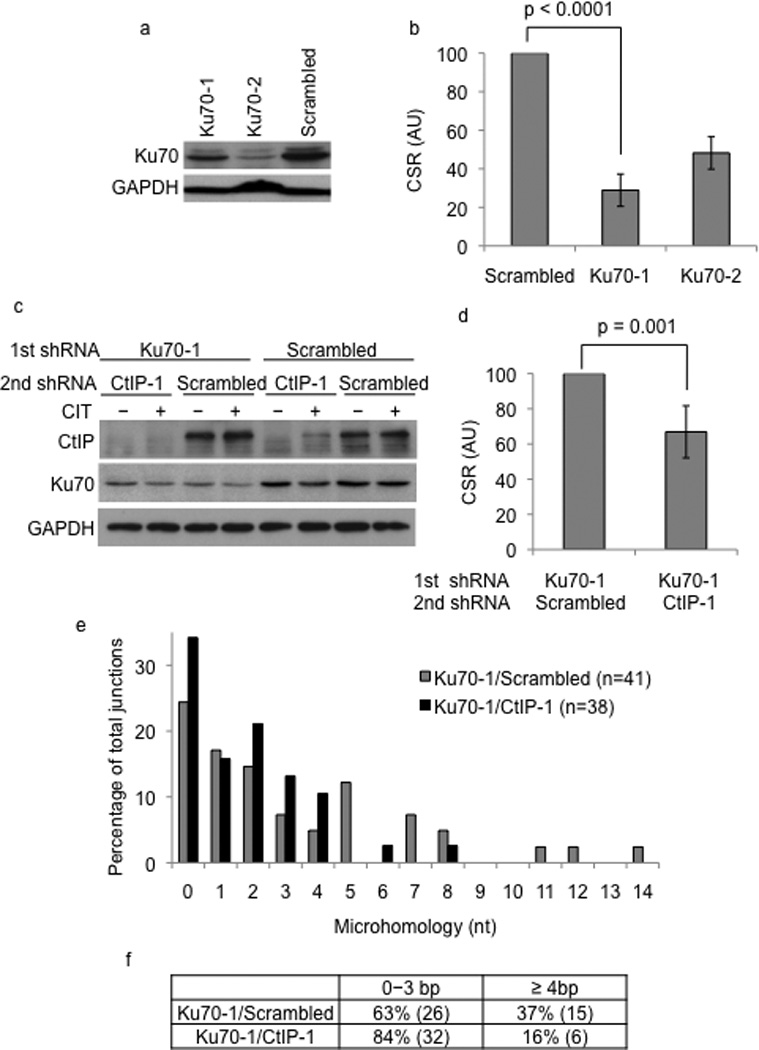
Figure 3.

CtIP knock-down alters end-joining in Ku70-deficient cells. (a) CIT-stimulated CH12 cells transduced with scrambled or shRNAs (Ku70-1, Ku70-2) against Ku70 were analyzed by western blotting using Ku70 or GAPDH (loading control) antibodies. (b) CSR to IgA in Ku70-1 or Ku70-2 shRNA transduced cells was measured by flow cytometry. CSR frequency in cells transduced with scrambled shRNA was assigned an arbitrary unit (AU) of 100. The data is a mean of at least three independent experiments with error bars indicating standard deviation from the mean. (c) Ku70 knock-down or control cells were transduced with scrambled or CtIP-1 shRNA and expression of Ku70, CtIP and GAPDH were determined by western blot analysis. (d) CH12 cells with the indicated shRNAs were stimulated with CIT for 72 hours and CSR to IgA was measured by flow cytometry. CSR frequency in cells transduced with scrambled shRNA was assigned an AU of 100. The data is a mean of nine independent experiments with error bars representing standard deviation from the mean. (e) Sµ-Sα junctions from Ku70-1/scrambled and Ku70-1/CtIP-1 cells were cloned, sequenced and the percentage of cells with the indicated lengths of microhomology was plotted. (f) The distribution of microhomology at the Sµ-Sα junctions is tabulated. The difference in the number of junctions with microhomology of 4 nucleotides or more between the Ku70-1/scrambled and Ku70-1/CtIP-1 knock-down cells was statistically significant (p=0.04).
