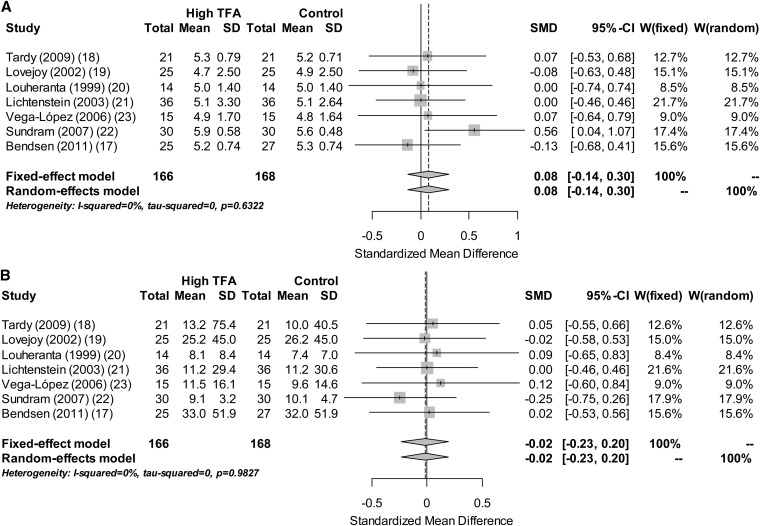
FIGURE 1.
Forest plots that summarize the results of the meta-analysis. Gray boxes denote the effect sizes of studies, and the size of each box is proportional to the weight given to each study. The whiskers bilateral to each gray box represent the 95% CI of the effect size of each study, and diamonds at the bottom of the graph represent the inverse-variance pooled-effect sizes of the meta-analysis, with the first diamond representing the results from the fixed-effect model and the second diamond representing the results from the random-effects model. The effect size is expressed as the SMD. On the left side of the Forest plot, the sample size and mean glucose (A) and insulin (B) concentrations and their SDs in the High TFA and Control groups of each study are shown. On the right side of the Forest plot, W(fixed) and W(random) represent the weight that was given to each study in the fixed- and random-effect meta-analysis model, respectively. SMD, standardized mean difference; TFA, trans fatty acid.

