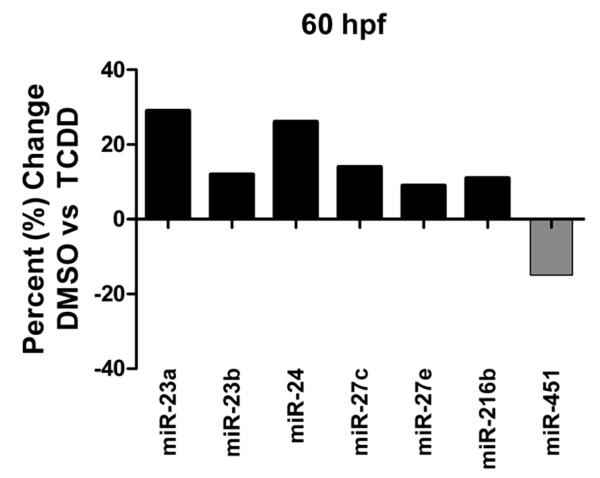
Figure 3.
TCDD-induced changes in microRNA expression observed with Agilent microarrays at 60 hpf. Data are expressed as percent change of expression normalized to the DMSO carrier control treatment. No significant changes in microRNA expression were observed at 36 hpf. Seven differentially expressed miRNAs were observed at 60 hpf. All seven of the miRNAs plotted in this graph were determined to be statistically significant based on an adjusted p-value <0.05 (Benjamini-Hochberg method).

