Figure 5.
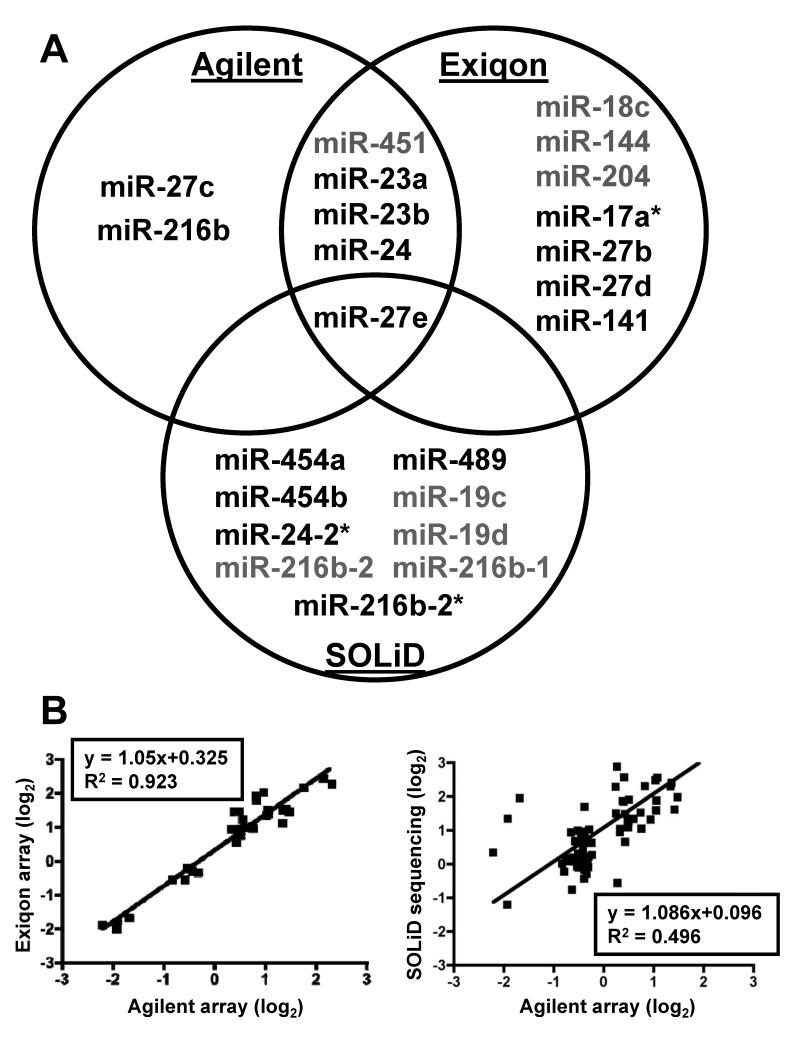
A) Venn diagram showing the significant TCDD-induced changes in microRNA expression measured by microarray or SOLiD sequencing analysis at 60 hpf. Each quantification method resulted in some unique changes in microRNAs but some changes were common to different platforms. The microRNA changes that were common to different methods are shown in the intersections of the circles. MicroRNAs shown in green were downregulated and those in red were upregulated. B) Left: Scattor plot showing the correlation between the developmental changes in microRNA expression (60 hpf vs 36 hpf) as measured by the two microarray platforms. Right: Scattor plot showing the correlation between the developmental changes in microRNA expression (60 hpf vs 36 hpf) as measured by SOLiD sequencing as compared to Agilent arrays. Fold change values of microRNAs that were common to both the platforms were plotted.

