Figure 2.
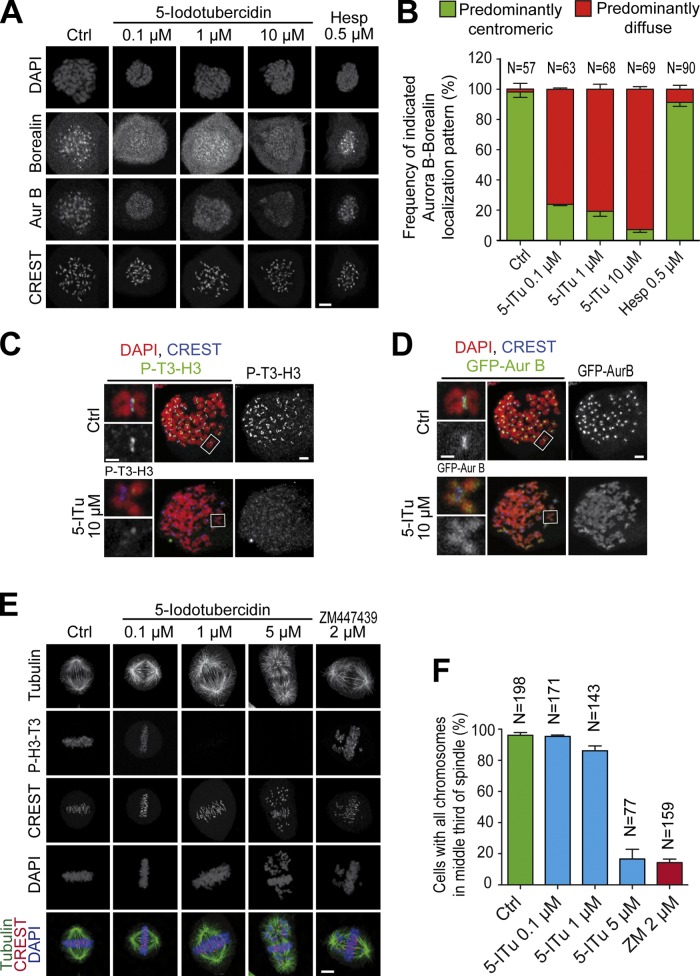
5-ITu displaces the CPC from centromeres. (A) Cells treated as in Fig. 1 B were supplemented with the indicated inhibitors and processed for immunofluorescence. Bar, 5 µm. (B) Quantitation of data shown in A. Localization of Aurora B and Borealin was analyzed for the indicated number of cells. Graphs report mean ± SEM. (C and D) Cultures of GFP-Aurora B HeLa cells were treated with 3.3 µM nocodazole for 12 h, after which 10 µM MG132 was added for 30 min. After a 90-min incubation with 10 µM 5-ITu, the mitotic population was isolated by mitotic shake-off and cells were prepared for immunofluorescence. Chromosome spreads were processed to visualize DAPI, CREST, P-T3-H3, and GFP-Aurora B. For presentation purposes, the P-T3-H3 and GFP-Aurora B signals are shown in two distinct panels with the same DAPI and CREST staining. Bar, 2 µm (insets, 1 µM). (E) HeLa cells were released from a double-thymidine arrest. After 6.5 h, the indicated inhibitors were added. After 30 min, 10 µM MG132 was added and after 90 min cells were harvested and processed for immunofluorescence. Bar, 5 µm. All images in this panel were acquired within the same experiment. (F) Quantitation of data from the experiment in E. The indicated number of cells for each condition was scrutinized for chromosome alignment defects. Graphs report mean ± SEM.

