Figure 3.
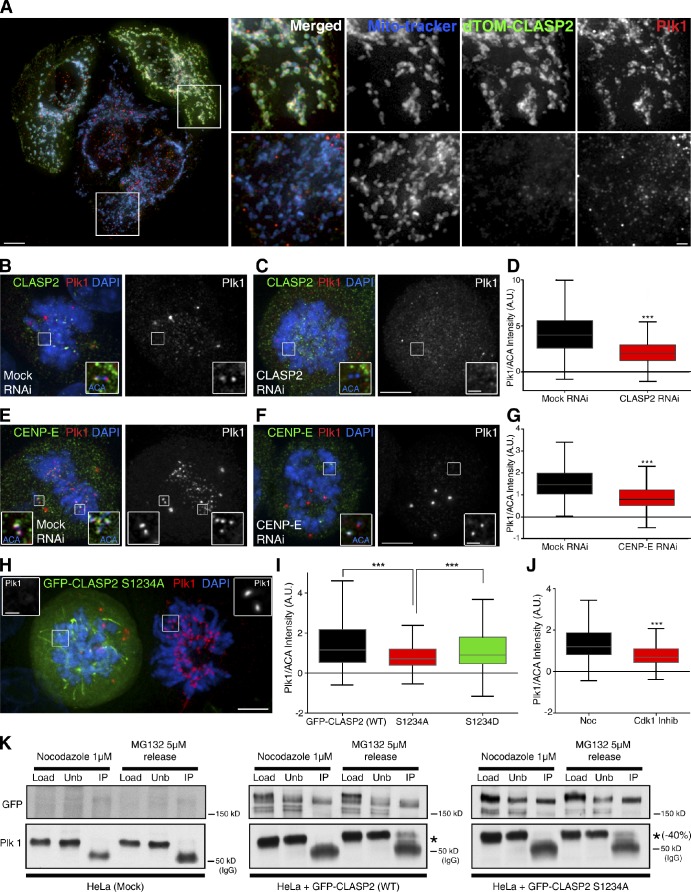
CLASP2 and its phosphorylation on S1234 by Cdk1 are required for normal recruitment of Plk1 to KTs. (A) HeLa cells transfected with dTOM20-CLASP2 construct to drive the ectopic localization of CLASP2 to the mitochondria. Cells were immunostained for Plk1 and mitochondria counter-stained with MitoTracker. (right) Insets of transfected (top) and nontransfected (bottom) cells. (B and C) Plk1 localization at KTs is reduced in HeLa cells after CLASP2 RNAi. (left) Merge image of cells immunostained for CLASP2 (green) and Plk1 (red), with DNA counterstained with DAPI (blue); (right) Plk1 localization alone. (D) Interquartile representation of normalized Plk1 KT intensity in Mock RNAi (n = 494) and CLASP2 RNAi (n = 559). Medians are statistically different, P < 0.0001, Mann-Whitney t test. (E and F) Plk1 localization at KTs is reduced in HeLa cells after CENP-E RNAi. (left) Merge image of cells immunostained for CLASP2 (green) and Plk1 (red), with DNA counterstained with DAPI (blue); right panel shows Plk1 localization alone. (G) Interquartile representation of normalized KT Plk1 levels, Mock RNAi (n = 483), and CENP-E RNAi (n = 492). Medians are statistically different, P < 0.0001, Mann-Whitney t test. (H) Overexpressing GFP-CLASP2 S1234A (green) HeLa cell (left) with an untransfected neighbor cell (right) immunostained for Plk1 (red or white in the insets) and DNA counterstained with DAPI (blues). Bars: 5 µm and 1 µm (higher magnifications). (I) Interquartile representation of normalized Plk1 intensities at KTs in cells expressing GFP-CLASP2 wild-type (n = 475), S1234A (n = 493), and S1234D mutant (n = 444). ***, medians are statistically different, P < 0.0001, Mann-Whitney t test. (J) Interquartile representation of normalized Plk1 KT intensities in control HeLa cells (n = 491) or upon Cdk1 inhibition (n = 459). Medians are statistically different, P < 0.0001, Mann-Whitney t test. All quantifications were standardized by nocodazole treatment. (K) Western blot analysis of nocodazole or nocodazole-released into MG132 HeLa cells after mock, GFP-CLASP2 WT, or S1234 transfection and IP with a GFP antibody. Native protein extracts (Load), unbound proteins (Unb), and IPs were analyzed by Western blotting with GFP or Plk1 antibodies. Asterisk indicates Plk1 and the respective reduction percentage in the S1234 mutant. The band at 50 kD corresponds to the antibody heavy chain (IgG).

