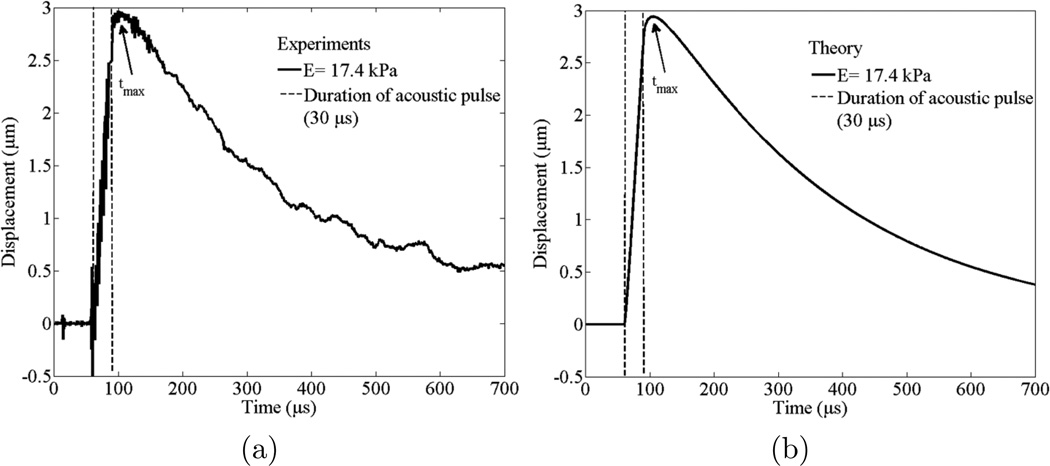
Figure 7.
(a) Experimentally measured and averaged displacement from three trials to one microbubble and (b) theoretically calculated displacement of the microbubble in response to 30 µs acoustic pulse. Average value of Young’s modulus (E) for plots (a) and (b) is 17.4 kPa and the shear viscosity is 1.5 Pa·s. Time of maxiumum displacement of microbubble is indicated as tmax. The dotted vertical lines indicate start and end of acoustic radiation force. The radius of the microbubble is 63±3 µm. Two plots (a) and (b) correspond to the experimental points in figure 8 marked by a circle.

