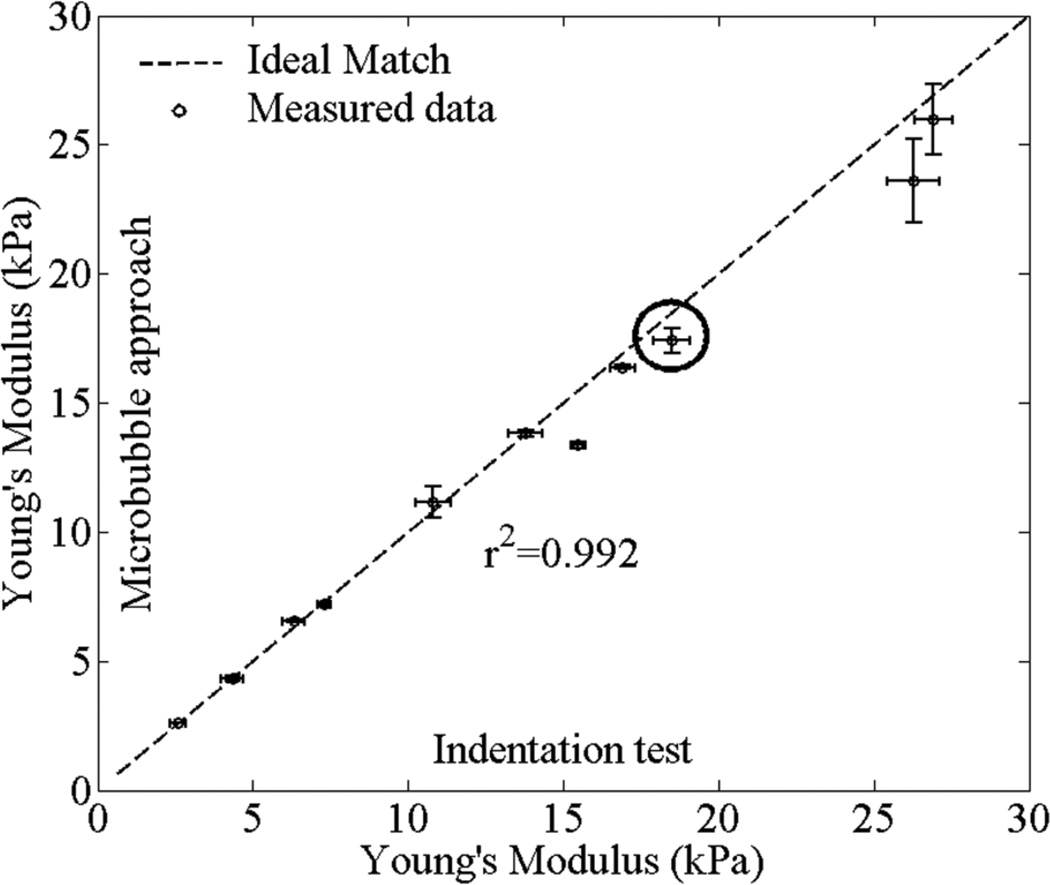
Figure 8.
Comparison of Young’s modulus values reconstructed using microbubble-based approach and measured using the indentation test. 11 laser-induced microbubbles created at 4 different bovine lenses were used. Three measurements were performed to each microbubble. Detailed example of the dynamics of the laser-induced microbubble of the experimental point marked by the circle is presented in figure 7. Error bars are plus/minus one standard deviation.

