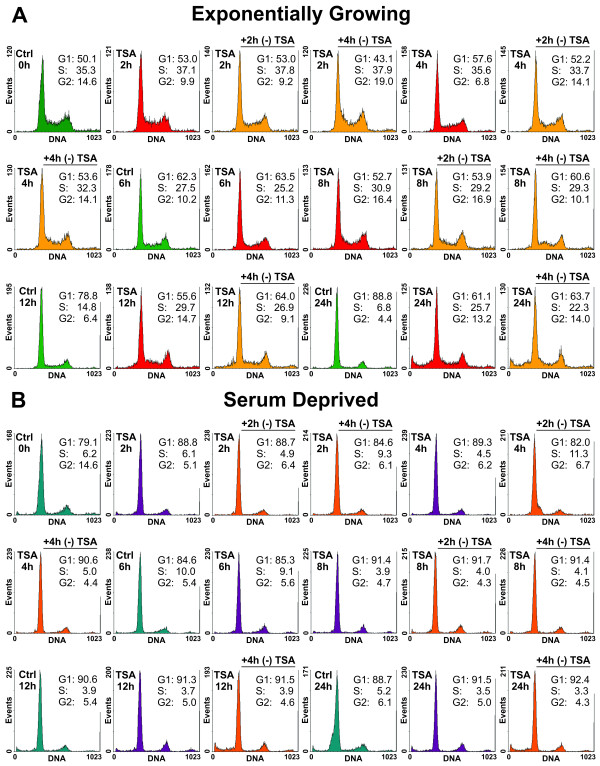
Figure 4 .
Cell cycle distribution of TSA treated Lig4-/- MEFs. Cell cycle distribution of exponentially growing (EG) and serum deprived (SD) Lig4-/- MEFs after treatment for different periods of time with 0.5 μM TSA. Shown are also results obtained with cells analyzed at different times after completion of TSA treatment. (A) Results obtained with EG cells. (B) Results obtained with SD cells.

