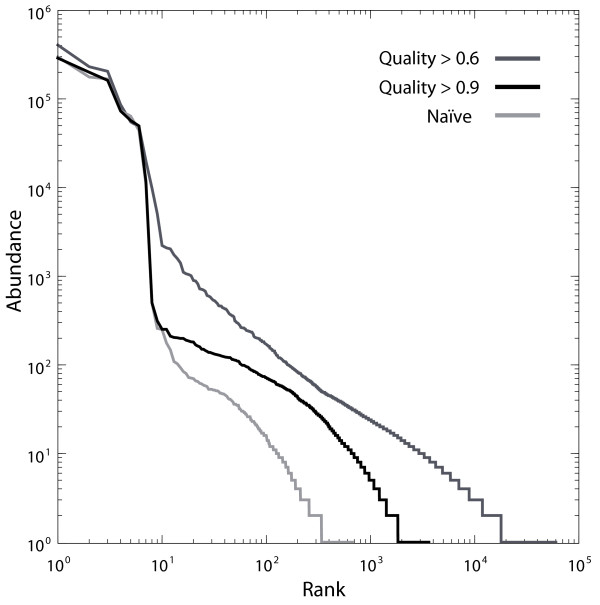
Figure 3.
Comparison of output of various assemblers. A scatter plot of the percentage of paired-end sequence assemblies from sequenced V3-region amplicons of Methylococcus capsulatus strain Bath against the average number of mismatching nucleotides between the assembled sequence and the reference sequence. The comparison was done between PANDAseq and three alternative assemblers (see text).

