
Figure 10.
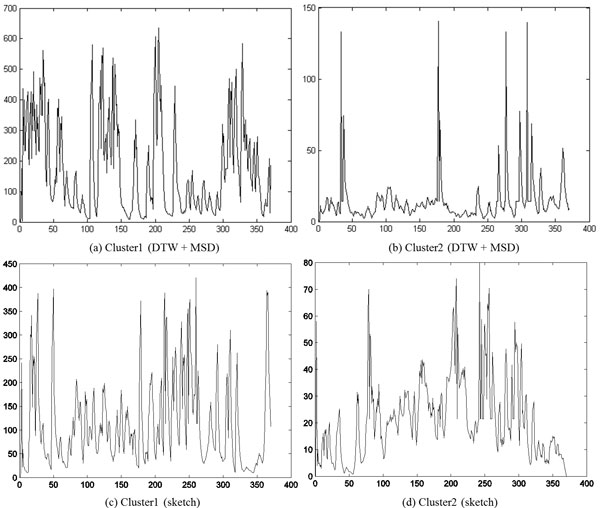
Representative time series of the two clusters. Note that the magnitude of (a) and (c) are greater than that of (b) and (d). The frame number is depicted on the X-axis while the Y-axis denotes the change in area.
Official websites use .gov
A
.gov website belongs to an official
government organization in the United States.
Secure .gov websites use HTTPS
A lock (
) or https:// means you've safely
connected to the .gov website. Share sensitive
information only on official, secure websites.
Representative time series of the two clusters. Note that the magnitude of (a) and (c) are greater than that of (b) and (d). The frame number is depicted on the X-axis while the Y-axis denotes the change in area.