
Figure 12.
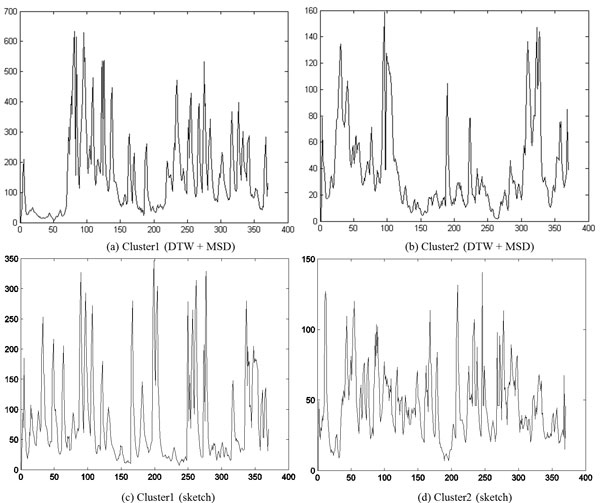
Representative time series of the two clusters. The data was collected on the seventh day after exposure to the drug Imipramine. Note that the magnitude of (a) is greater than that of (b) and the magnitude of (c) is also greater than that of (d). In this figure the frame number is depicted on the X-axis and the change in the size of the parasites is shown on the Y-axis.