
Figure 16.
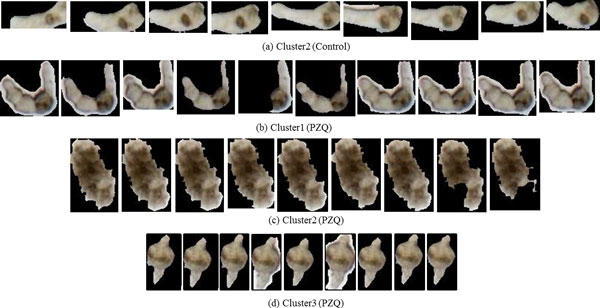
Shapes of the representative parasites over time. Starting from the first frame, the snapshots are taken every 45th frame. (a) Representative of the dominant cluster in the control data. (b - d) The representative parasites from each of the three clusters found in the set that was exposed to PZQ. The reader may note the distinct differences of the phenotypic response of the parasites in each of the clusters.