
Figure 18.
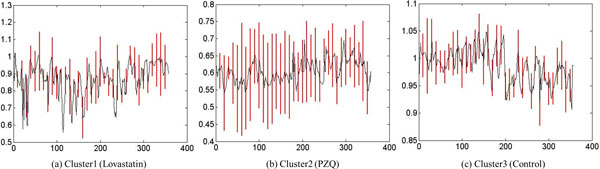
Representative time series and standard deviation of each cluster, a = 4. The frame number is shown on the X-axis. The Y-axis depicts the descriptor: End Point Length/Skeleton Length.
Official websites use .gov
A
.gov website belongs to an official
government organization in the United States.
Secure .gov websites use HTTPS
A lock (
) or https:// means you've safely
connected to the .gov website. Share sensitive
information only on official, secure websites.
Representative time series and standard deviation of each cluster, a = 4. The frame number is shown on the X-axis. The Y-axis depicts the descriptor: End Point Length/Skeleton Length.