
Figure 2.
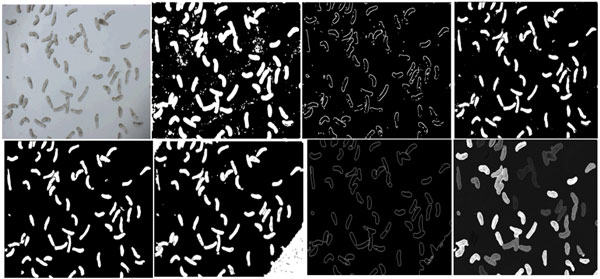
Illustration of the segmentation results and comparison with other methods. Top row from left-to-right: The original image (note that the bottom right region has a shadow), results of the region-based distributing function showing oversegmentation, relevant edges, and the image after filtering of debris and small regions. Bottom row from left-to-right: Final results with the proposed method after closing and filling holes in regions and separation of touching parasites, results obtained by mean-shift segmentation [7], results of JSEG segmentation [9], and results from the active-mask segmentation method [35].