
Figure 5.
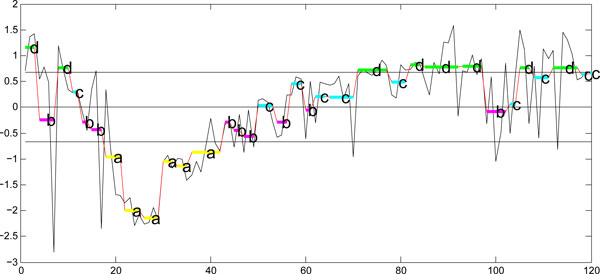
Optimal segmentation and symbolic representation of the time-series from Figure 4(a). The frame number is shown on the X-axis and the parasite body size (in pixels) is shown on the Y-axis.
Official websites use .gov
A
.gov website belongs to an official
government organization in the United States.
Secure .gov websites use HTTPS
A lock (
) or https:// means you've safely
connected to the .gov website. Share sensitive
information only on official, secure websites.
Optimal segmentation and symbolic representation of the time-series from Figure 4(a). The frame number is shown on the X-axis and the parasite body size (in pixels) is shown on the Y-axis.