Figure 7.

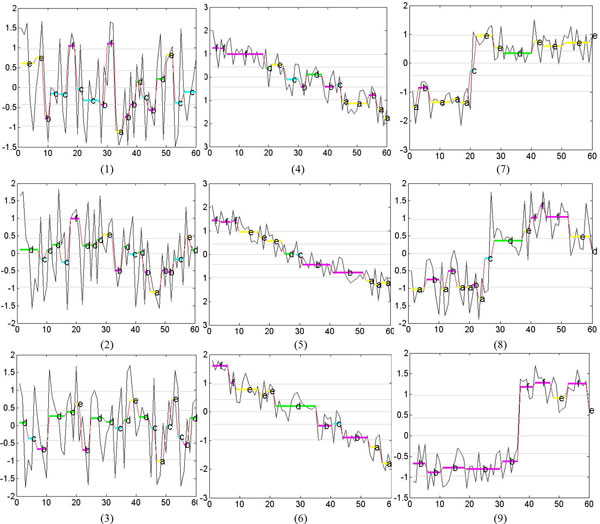
Optimal segmentation and symbolic representation of the sequences from the UCI database with a = 6. The X-axis denotes the time step and the sequence value is shown on the Y-axis.

Optimal segmentation and symbolic representation of the sequences from the UCI database with a = 6. The X-axis denotes the time step and the sequence value is shown on the Y-axis.