
Figure 8.
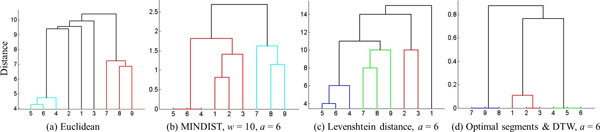
Dendrograms constructed by the agglomerative hierarchical clustering for the UCI dataset. The X-axis denotes the sequence number and the Y-axis denotes values obtained using various distance measures.
Official websites use .gov
A
.gov website belongs to an official
government organization in the United States.
Secure .gov websites use HTTPS
A lock (
) or https:// means you've safely
connected to the .gov website. Share sensitive
information only on official, secure websites.
Dendrograms constructed by the agglomerative hierarchical clustering for the UCI dataset. The X-axis denotes the sequence number and the Y-axis denotes values obtained using various distance measures.