
Figure 9.
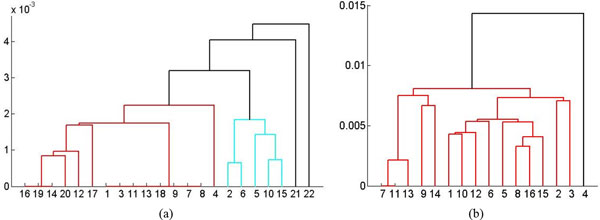
Dendrograms constructed by agglomerative hierarchical clustering using values of the image difference descriptor: (a) Control group (b) Phenotypes measured on the 7th day after exposed to drug Imipramine. The X-axis: denotes the sequence number and the Y-axis denotes distance.