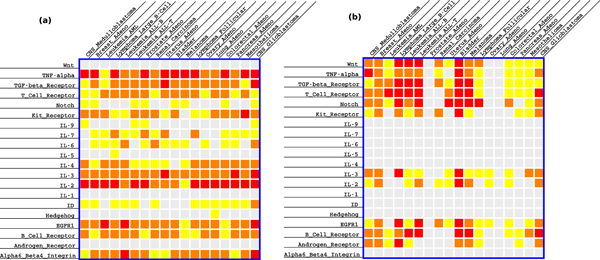
Figure 4.
An overview of the perturbations of 20 Netpath pathway in 18 cancers in the GCM dataset. Each row is a pathway and each column is a cancer. The color of a cell indicates the FDR-corrected p-value of the perturbation of a pathway in a cancer: red = 0.001, orange ≤ 0.01, yellow ≤ 0.05, and gray >0.05. (a) Results obtained by our algorithm. (b) Results obtained with Sub-GSE.

