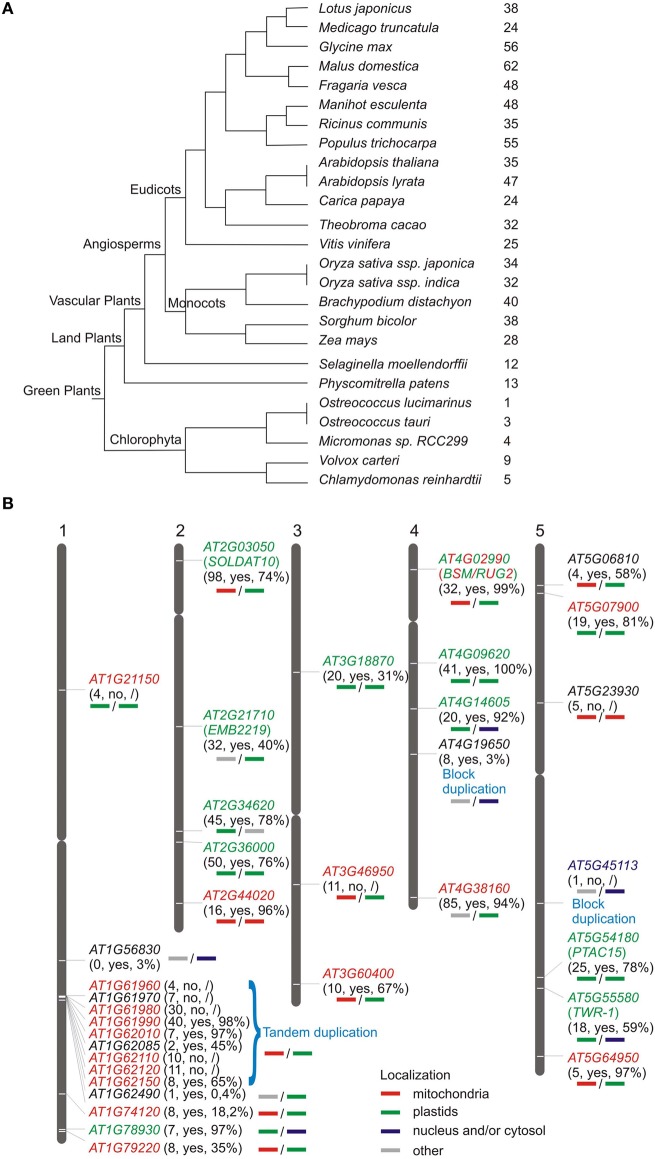
Figure 1.
Distribution of genes encoding mTERF proteins in plants. (A) Numbers of MTERF genes in sequenced green plants according to the PLAZA database (http://bioinformatics.psb.ugent.be/plaza/). (B) Chromosomal distribution of A. thaliana MTERF genes. Approximate positions of MTERF genes are displayed on the respective chromosome. The first numbers in parentheses report the EST support values; “yes” or “no” indicates whether or not the respective MTERF is represented on Affymetrix ATH1 arrays; the percentage value indicates the fraction of all microarray datasets deposited in the Genevestigator database (https://www.genevestigator.com/gv/; Hruz et al., 2008) that record the presence of transcripts of the various MTERF genes. Predicted localizations for the different mTERF proteins were inferred from WolF PSORT (http://wolfpsort.org/) and TargetP (http://www.cbs.dtu.dk/services/TargetP/) scores (bold lines under the respective MTERF genes); the experimentally determined localizations for all mTERF proteins (Babiychuk et al., 2011) and for AT4G02990 (Quesada et al., 2011) are indicated in colored lettering.

