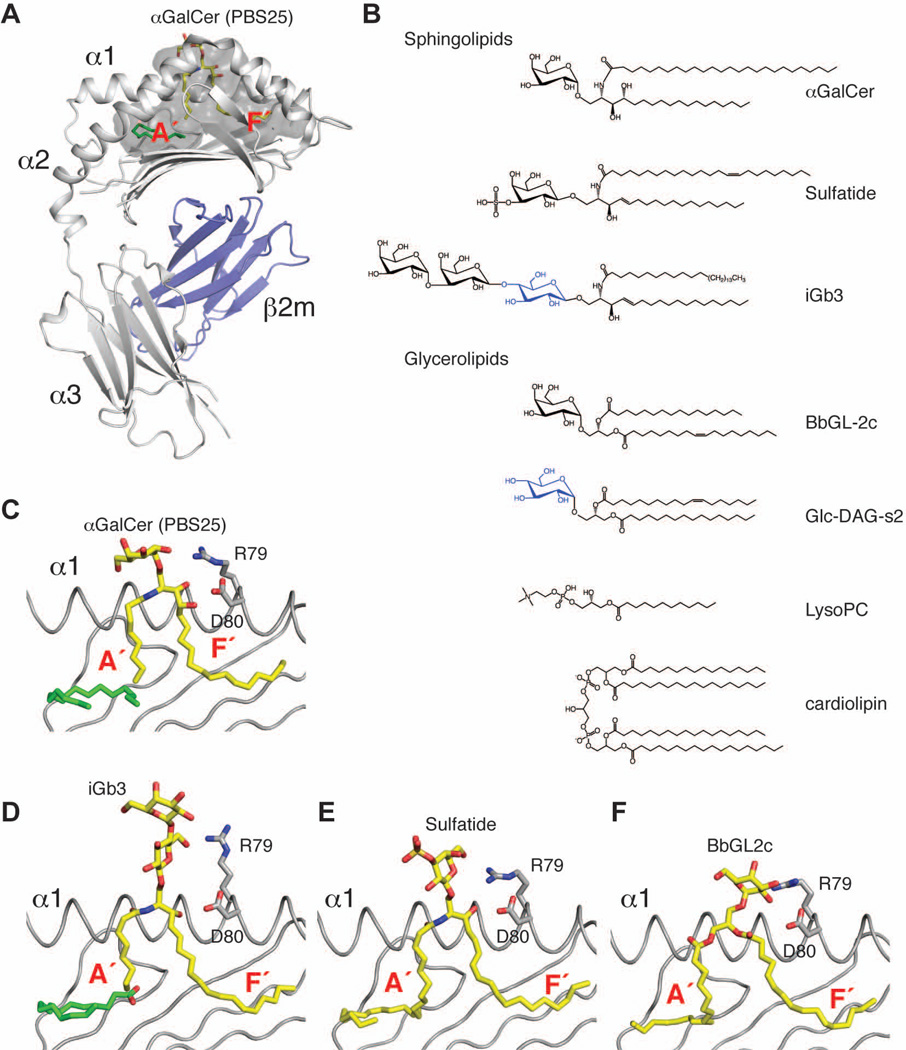
Fig. 1. Antigen presentation by CD1d.
(A). Cartoon representation of the CD1d-β2m heterodimer (PDB ID 1Z5L) with CD1d in grey, β2m in blue, the αGalCer analog PBS25 in yellow and a lipid spacer in green. The antigen-binding groove is shown as a transparent dark grey surface. (B). Several lipid antigens recognized by CD1d-restricted T cells. Glucosyl moieties are shown in blue. (C–F). Detailed view of the antigen binding groove with the α2 helix removed for clarity. Ligands (C: PBS25, PDB ID 1Z5L; D: iGb3, PDB ID 2Q7Y; E: sulfatide, PDB ID 2AKR; F: BbGL2c, PDB ID 3ILQ) are shown in yellow, spacers in green.

