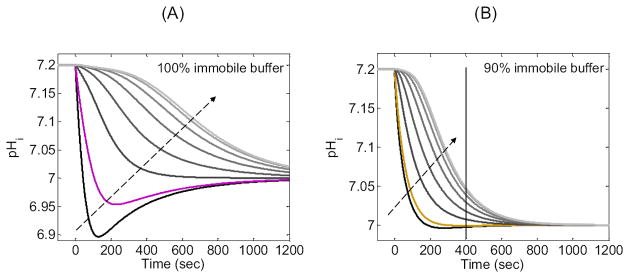
Figure 12.
Exploring the effects of 100% or 90% immobile buffer on the pHi time profile at eight depths into the cell. (A) Family of pH time profiles based on the simulation in Figure 11B for 100% immobile buffer. The black curve represents a depth of ≈ 10 μm. The magenta curve is the same as in Figure 11B, and represents a depth of ≈ 50 μm. The gray curves, in the direction of the arrow, represent increasing depths beneath the membrane of ≈ 150 μm, ≈ 250 μm, ≈ 350 μm, ≈ 450 μm, ≈ 550 μm and ≈ 650 μm (i.e., near the center of the cell). (B) Family of pH time profiles based on the simulation in Figure 11B for 90% immobile buffer. The gold curve is the same as in Figure 11B, and represents a depth of ≈ 50 μm. The other colors and the arrow have the same meaning as in panel A.

