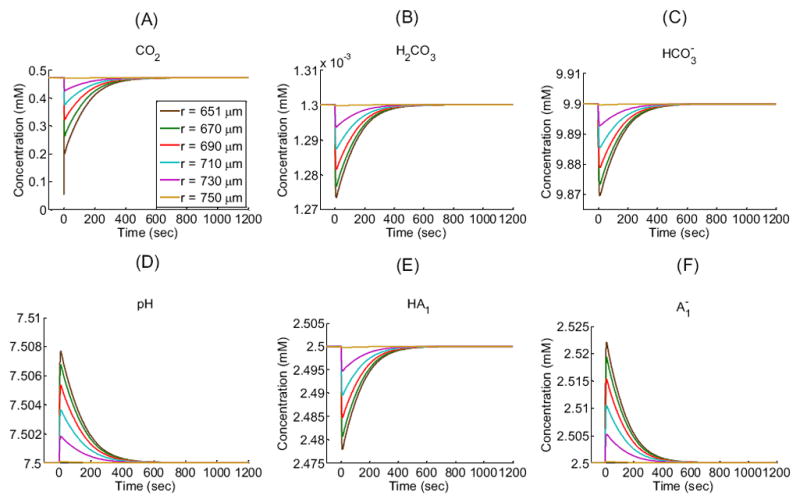
Figure 3.

Extracellular concentration-time profiles for solutes (CO2, H2CO3, HCO3−, H+ as pH, HA1, ) in a “standard in-silico experiment” at five exterior radial distances (r) from the center of an oocyte of radius R = 650 μm: 651 μm (i.e., 1 μm away from the outer surface of the membrane), 670 μm, 690 μm, 710 μm, and 730 μm in the extracellular unconvected fluid as well as 750 μm at the border with the bulk extracellular fluid. These data are the extracellular counterpart of the data in Figure 4. See Table 1 and Table 2 for parameter values.
