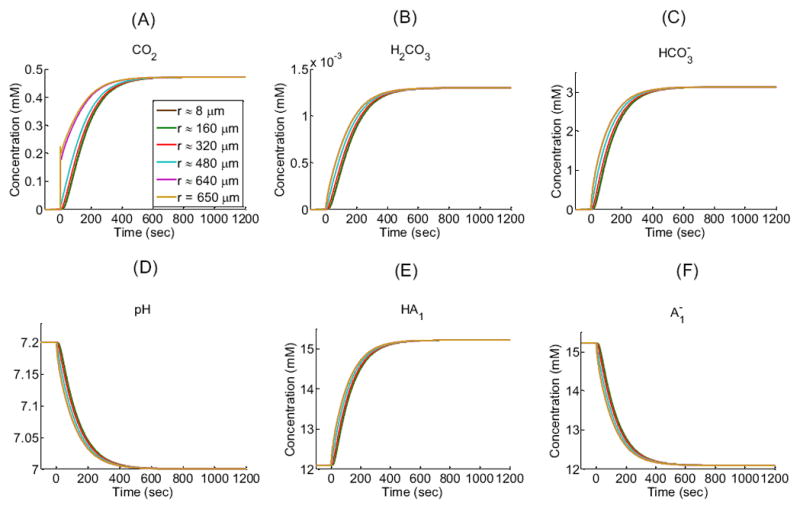
Figure 4.

Intracellular concentration-time profiles for solutes (CO2, H2CO3, HCO3−, H+ as pH, HA1, ) in a “standard in-silico experiment” for five interior radial distances (r) from the center of an oocyte of radius R = 650 μm: ≈ 8 μm (i.e., close to the center), ≈ 160 μm, ≈ 320 μm, ≈ 480 μm, ≈ 640 μm and at 650 μm (i.e., the cytosolic surface of the plasma membrane). Note that the green curve for r ≈160 μm almost completely overlies the brown curve for r ≈ 8 μm. See Table 1 and Table 2 for parameter values.
