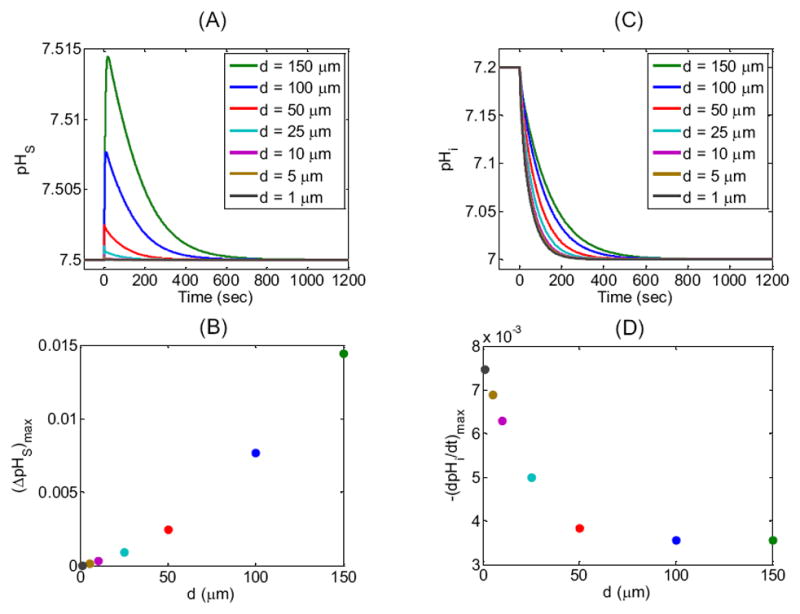
Figure 6.

Effect of changing the width d of the extracellular unconvected fluid on the surface (pHS) and intracellular pH (pHi) time profiles. (A) pHS transients for seven simulations corresponding to seven values of d (see legend and Table 3 for parameter values). (B) Maximum height of the pHS spike—(ΔpHS)max—as a function of d for the seven simulations reported in (A). (C) Corresponding pHi transients at a depth of ≈ 50 μm for the simulations in (A). (D) Maximal rate of pHi change—(dpHi/dt)max—as a function of d for the seven simulations reported in (C).
