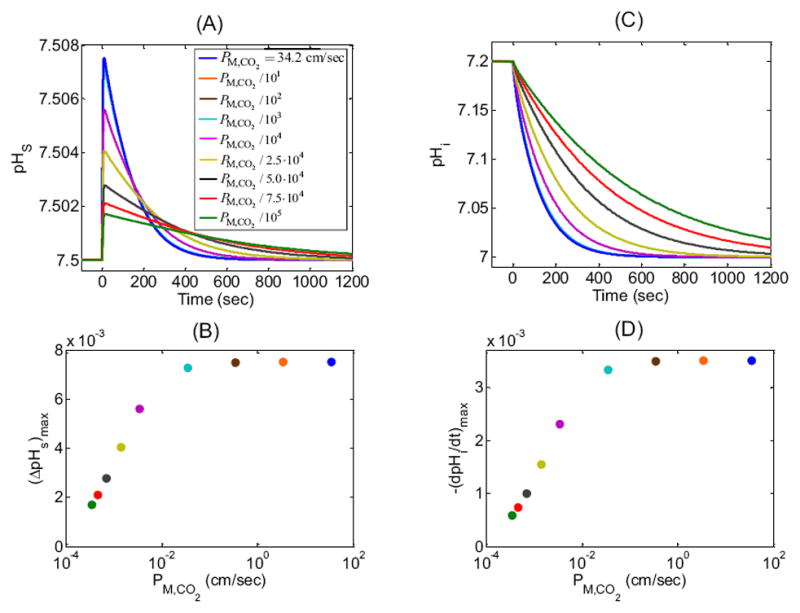
Figure 7.

Effect of changing CO2 membrane permeability (PM,CO2) on the surface (pHS) and intracellular pH (pHi) time profiles. We show results of nine simulations for PM,CO2 = 34.20 cm/sec (blue, “standard in-silico experiment”, which corresponds to the mobility of CO2 in H2O) and for PM,CO2 reduced by factors of 101, 102, 103, 104, 2.5·104, 5.0·104, 7.5·104 and 105. (A) pHS transients for the nine simulations. Note that virtually superimposable on the blue curve are the ones for which PM,CO2 is reduced by factors of 101, 102, and 103. (B) Maximum height of the pHS spike—(ΔpHS)max—as a function of PM,CO2 for the nine simulations reported in (A). (C) pHi transients at a depth of ≈ 50 μm for the simulations in (A). Note that virtually superimposable on the blue curve are the ones for which PM,CO2 is reduced by factors of 101, 102, and 103. (D) Maximal rate of pHi change—(dpHi/dt)max—as a function of PM,CO2 for the nine simulations reported in (C).
