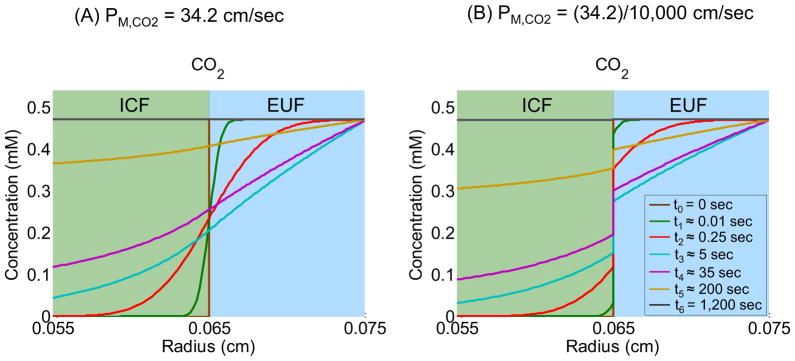
Figure 8.
Effects of reducing the CO2 membrane permeability (PM,CO2) on [CO2]-distance profiles at seven time instances: t0 = 0 sec, t1 ≈ 0.01 sec, t2 ≈ 0.25 sec, t3 ≈ 5 sec, t4 ≈ 35 sec, t5 ≈ 200 sec and t6 ≈ 1,200 sec. (A) Simulation corresponding to the “standard in-silico experiment” (PM,CO2 = 34.2 cm/sec). (B) Simulation corresponding to the experiment in which PM,CO2 is reduced by a factor of 104.

