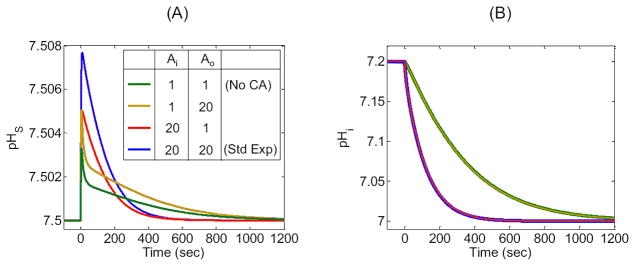
Figure 9.
Effects of changing the extracellular CA-like activity (Ao) and intracellular CA-like activity (Ai) on the surface (pHS) and intracellular pH (pHi) time profiles. (A) pHS transients for four simulations corresponding to all combinations of Ao and Ai acceleration factors of 1 or 20. (B) Corresponding pHi-time profiles at a depth of ≈ 50 μm. Note that, in this panel, the green and gold curves overlap, as do the blue and red curves. The blue curves reproduce the “standard in-silico experiment”.

