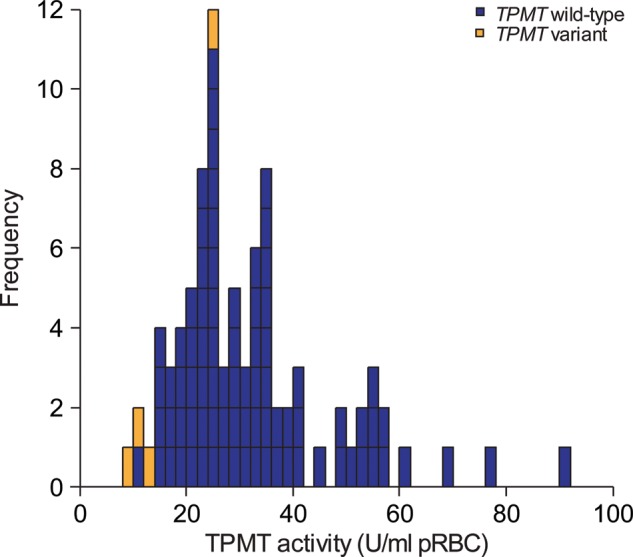
Figure 1.

Distribution of TPMT activity measured in 87 HapMap CEU cell lines. Each rectangle represents the TPMT activity value measured in one cell line. Blue rectangles represent cell lines from individuals with wild-type TPMT, whereas orange rectangles represent cell lines from individuals with variant TPMT (rs1142342 AG genotype); the four cell lines from subjects heterozygous for the rs1142345 SNP (i.e. AG genotype) had significantly lower TPMT activity than the 83 cell lines with the AA wild-type genotype for this SNP (P-value Welch test = 0.00026) (11).
