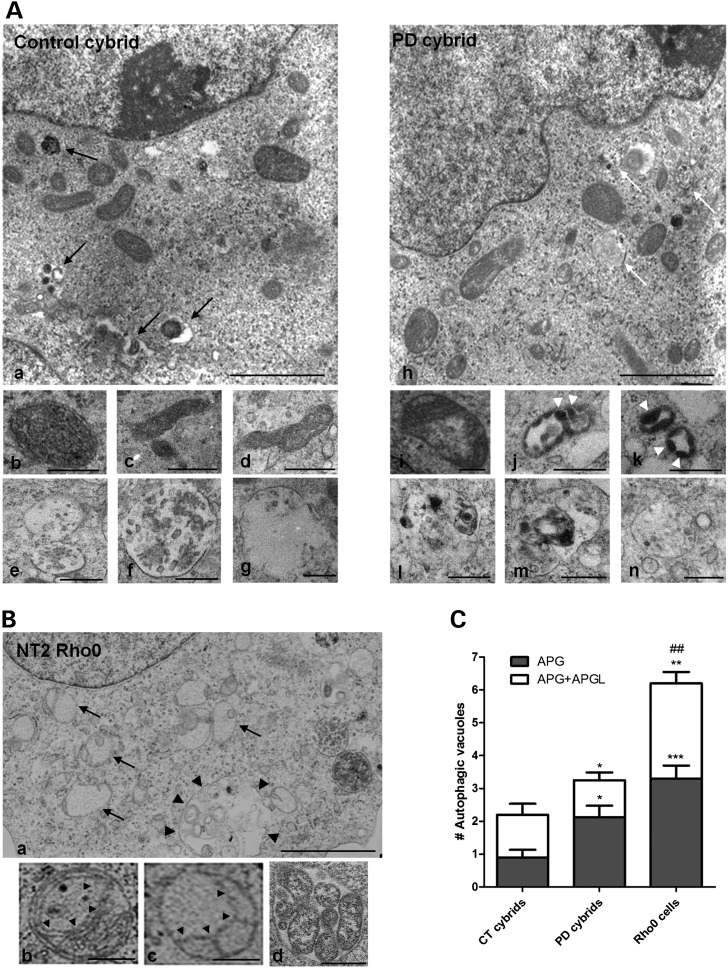
Figure 2.
Mitochondrial deficits induced the accumulation of morphologically abnormal mitochondria and nonfused autophagic vacuoles. (A) Electron micrographs of CT and sPD cybrids. Lower inserts show higher magnification images to illustrate morphological features of mitochondria and individual examples of autophagic vacuoles in both CT and sPD cybrids. Black arrows, autophagolysosomes; white arrows, autophagosomes; arrows heads, electron-dense amorphous inclusions within mitochondria. Scale bars: 2 µm (top) and 0.5 µm (middle and bottom). (B) Electron micrographs of NT2 Rho0 cells. Higher magnification fields show morphological features of mitochondria and autophagic vacuoles in Rho0 cells. (a) Dark arrows: swollen pale mitochondria with discontinuous cristae; Dark arrow heads: enlarged autophagosome enclosing mitochondria and other materials; (b and c) dark arrow heads: abnormal membranous structures. Scale bars: 2 µm (top) and 0.5 µm (bottom). (C) Quantification of autophagosomes (APG) and autophagolysosomes (APGL) in cybrid cell lines and mtDNA-depleted (Rho0) cells. The total number of vesicles was quantified from 15 cell profiles for each cell line. (n= 3, *P< 0.05, ***P< 0.001, versus APG CT cybrids; *P< 0.05, **P< 0.01, versus APG+APGL CT cybrids; ##P< 0.01, versus APG+APGL sPD cybrids).

