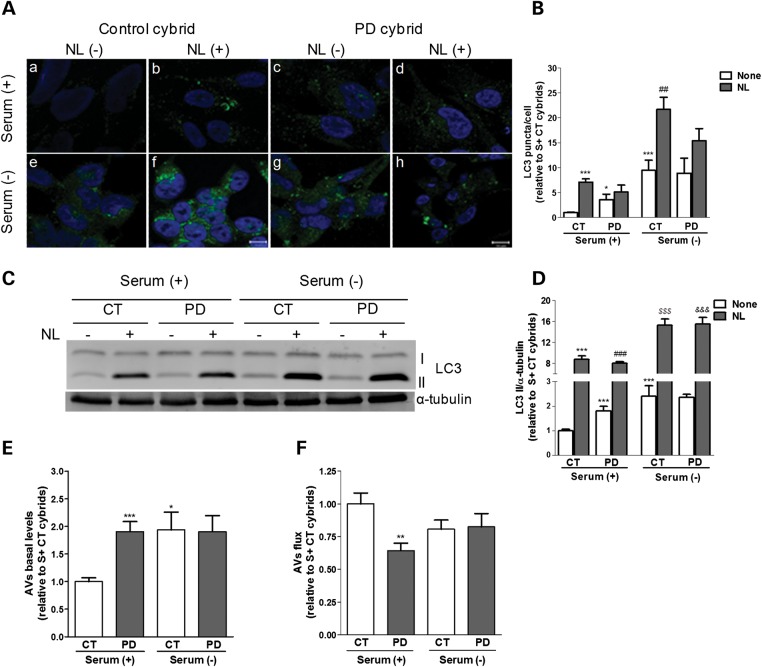
Figure 3.
QC autophagic response is impaired in cells harboring sPD patient mitochondria. (A) LC3B immunostaining (green) of CT and sPD cybrids maintained in the presence [Serum (+)] or absence [Serum (−)] of serum and inhibitors of lysosomal proteolysis [NL (+); NL (−)]. Hoechst 33342-stained nuclei are in blue. (B) Mean number of LC3B-positive vesicles per cell profile (n= 3, *P< 0.05, ***P< 0.001 versus S+ CT cybrids; ##P< 0.01 versus S− CT cybrids). Scale bar: 10 µm. (C) Immunoblot for endogenous LC3B from CT and sPD cybrids after culture in serum (+) or serum (−) conditions and treatment with NL. (D) Densitometric analysis of endogenous levels of LC3B (n= 18, ***P< 0.001 versus S+ CT cybrids; ###P< 0.001 versus S+ sPD cybrids; $$$P< 0.001 versus S− CT cybrids; &&&P< 0.001 versus S− sPD cybrids). (E) Determination of autophagic vacuole (AV) levels. Values of LC3-II in the absence of NL represent the steady-state AV content (n= 18, *P< 0.05, ***P< 0.001 versus S+ CT cybrids). (F) Assessment of autophagic flux, calculated as the ratio of LC3-II densitometric value of NL-treated samples over the corresponding untreated samples (n= 18, **P< 0.01 versus S+ CT cybrids).

