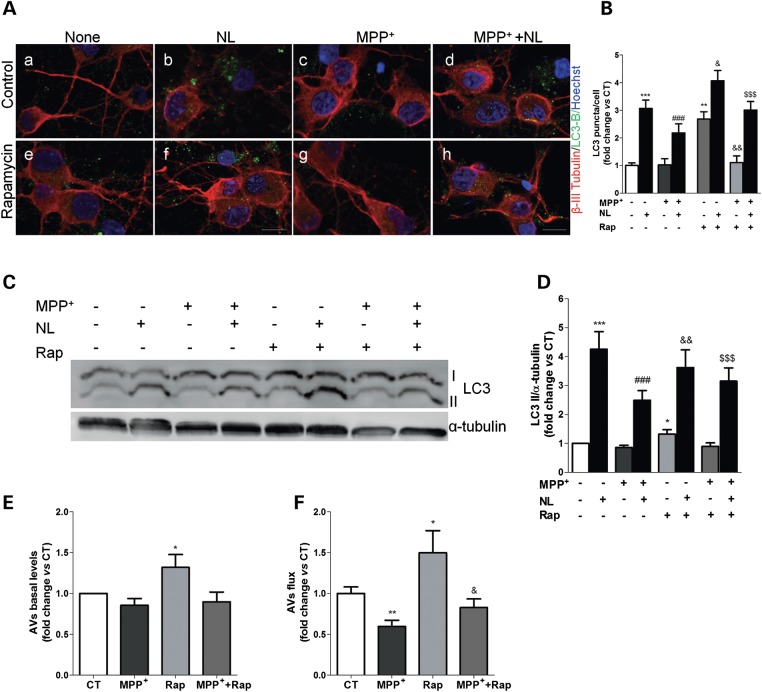
Figure 5.
MPP+-induced mitochondrial dysfunction mediates autophagy-lysosome pathway impairments in primary cortical neurons. (A) LC3B immunostaining (green) of primary cortical neurons treated with MPP+ for 24 h. In the last 4 h, cells were co-treated with or without rapamycin and lysosomal inhibitors (NL). Beta-III-tubulin (red) and Hoechst 33342 (blue) co-staining were used as a neuronal and nuclei markers, respectively. Scale bar: 10 µm. (B) Mean number of LC3B-positive vesicles per cell profile (n= 3, **P< 0.01, ***P< 0.001, versus CT; ###P< 0.001, versus MPP+-treated cells; &P< 0.05, &&P< 0.01, versus rapamycin (Rap)-treated cells; $$$P< 0.001, versus Rap+MPP+-treated cells. (C) LC3B immunoblot of the same cells after MPP+ (24 h) or rapamycin (Rap, 4 h) treatment. (D) Densitometric analysis of LC3B endogenous levels (n= 13, *P< 0.05, ***P< 0.001, versus untreated cells; ###P< 0.001, versus MPP+-treated cells; &&P< 0.01, versus Rap-treated cells; $$$P< 0.001, versus Rap+MPP+-treated cells). (E) Determination of autophagic vacuole (AV) levels. Values of LC3-II in the absence of NL represent the steady-state AV content (n= 13, *P< 0.05, versus CT). (F) Assessment of autophagic flux, calculated as the ratio of LC3-II densitometric value of NL-treated samples over the corresponding untreated samples (n= 13, *P< 0.05, **P< 0.01, versus CT; &P< 0.05, versus Rap-treated cells).

