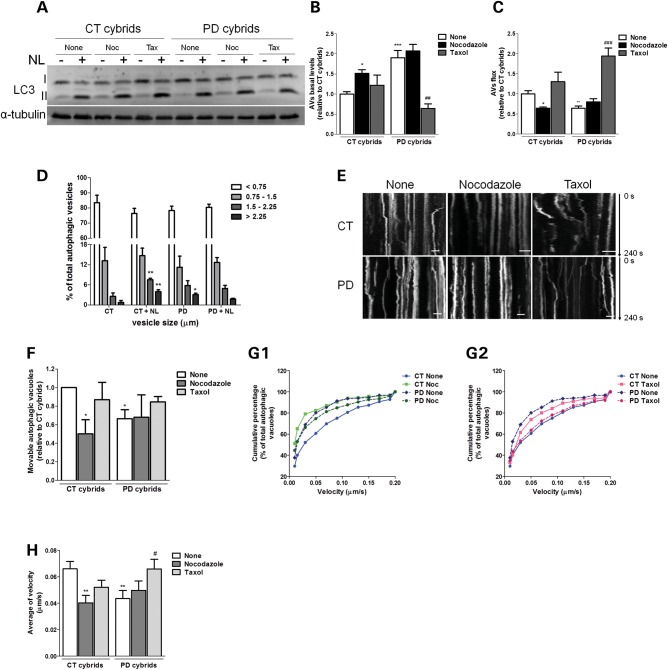
Figure 8.
Disruption of microtubule network results in a deficient autophagic turnover and reduced autophagic vesicle movements in sPD cybrid cells. (A) Immunoblot for endogenous LC3B from CT and sPD cybrids after treatment with taxol (Tax) or nocodazole (Noc) for 24 h. In the last 4 h, cells were co-treated with or without lysosomal inhibitors (NL). (B) Determination of autophagic vacuole (AV) levels. Values of LC3-II in the absence of NL represent the steady-state AV content (n= 4, *P< 0.05, ***P< 0.001, versus CT cybrids; ##P< 0.01 versus sPD cybrids). (C) Assessment of autophagic flux, determined as the ratio of LC3-II densitometric value of NL-treated samples over the corresponding untreated samples (n= 4, *P< 0.05, **P< 0.01, versus CT cybrids; ###P< 0.001 versus sPD cybrids). (D) Accumulation of AVs in CT and sPD cybrid cells. LC3B immunostaining was used to determine AV size distribution from CT and sPD cybrids after treatment with or without lysosomal inhibitors (NL). AV size distribution was graphed as percent of total vacuoles within the indicated size ranges (n= 4, *P< 0.05, **P< 0.001, versus CT cybrids). (E) Representative kymograph images (out of three experiments) of AV movement in CT and sPD cybrid cells treated with nocodazole (24 h) or taxol (24 h). Scale bars: 5 µm. (F) Number of movable AVs when compared with those of total AVs (n= 3, *P< 0.05, versus CT cybrids). (G1 and 2). Cumulative data for AV transport velocity in CT and sPD cybrid cells treated with Noc (G1) or treated with taxol (G2) (n= 3). (H) Average transport velocity of AVs (μm/s) (n= 3, **P< 0.01, versus CT cybrids; #P< 0.05, versus sPD cybrids).

