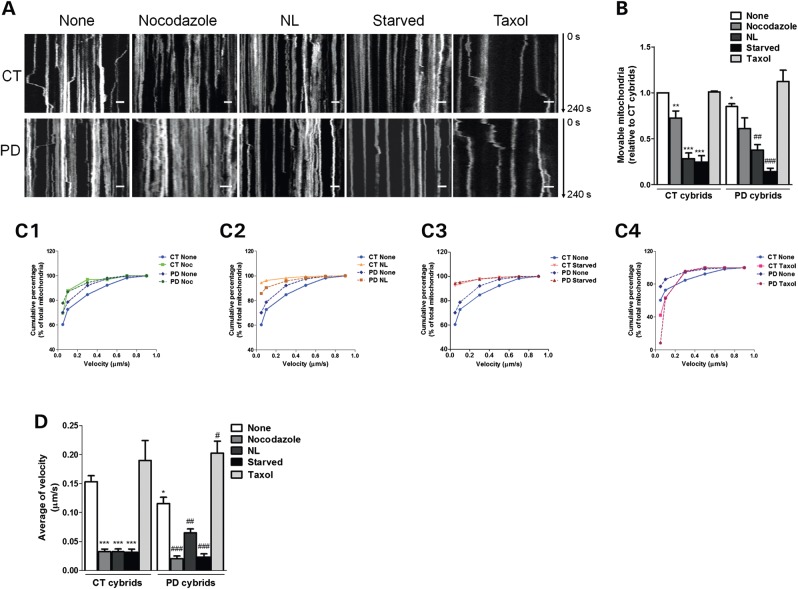
Figure 9.
Disruption of microtubule network results in reduced mitochondrial movements in sPD cybrid cells. (A) Representative kymograph images (out of three experiments) of mitochondrial movement in CT and sPD cybrid cells treated with nocodazole (24 h), taxol (24 h) and lysosomal inhibitors (NL, 4 h) or subjected to starvation (starved, 6 h). Scale bars: 5 µm. (B) Number of movable mitochondria when compared with those of total mitochondria (n= 3, *P< 0.05, **P< 0.01, ***P< 0.001, versus CT cybrids; ##P< 0.01, ###P< 0.001, versus sPD cybrids). (C1–4) Cumulative data for mitochondrial transport velocity in CT and sPD cybrid cells treated with Noc (C1), NL (C2), subjected to starvation (C3) or treated with taxol (C4) (n= 3). (D) Average transport velocity of mitochondria (μm/s) (n= 3, *P< 0.05, ***P< 0.001, versus CT cybrids; #P< 0.05,##P< 0.01,###P< 0.001, versus sPD cybrids).

