
Figure 6.
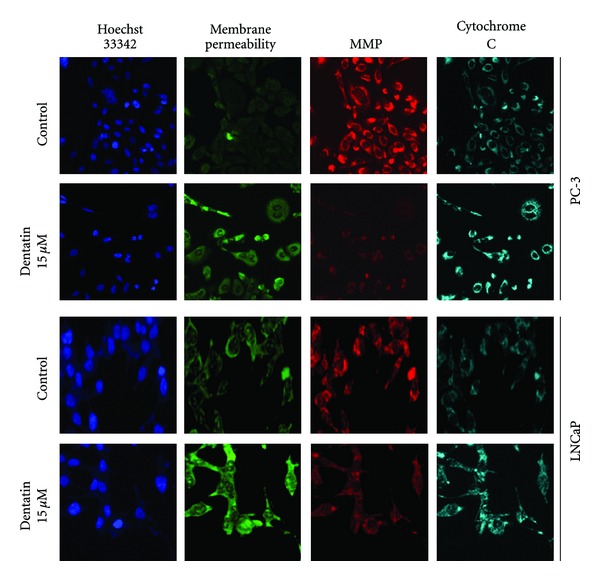
Multiparameter cytotoxicity analysis of dentatin-treated PC-3 and LNCaP cell lines. Representative images of PC-3 or LNCaP cells treated with medium alone (control) or 15 μM of dentatin. Cells were stained with Hoechst 33342, cell membrane permeability dye, MMP dye, and cytochrome c antibody as described in Section 2. (Magnification at 20x.)